-
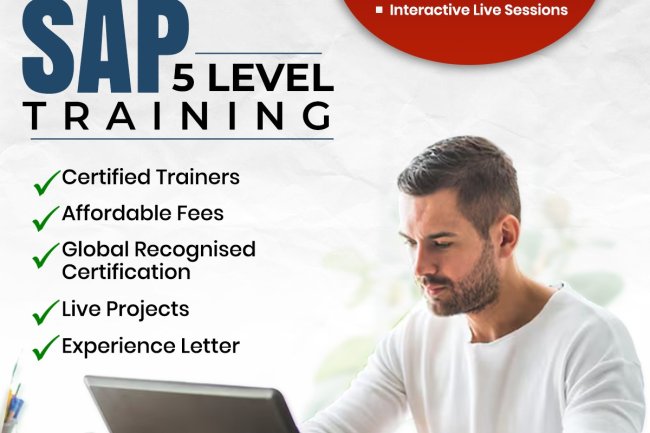
In today’s competitive job market, having practical, globally recognized skills is essential for career growth. The SAP Level 5 Training Program is designed to help aspiring professionals and working individuals gain industry-ready expertise in SAP HCM, SAP SuccessFactors, and Workday. These platforms are widely used by organizations worldwide to manage HR operations, talent, payroll, and workforce analytics efficiently.
-
Learn SAP ABAP course in India 2026 and boost your career with ZebLearn India's SAP ABAP training program, get certified and increase your salary
-
Learn SAP FICO modules with ZebLearn India's expert training and certification, boost your finance career with SAP FICO
-
Unlock a rewarding SAP HCM career path with ZebLearn India's expert guidance and training, boosting your career prospects
-
What full-stack developers actually earn in India in 2026 — salary bands by experience, why company type matters more than years, city and stack differences, the skills that move offers most, and why published figures vary so widely.
-
25 Salesforce administrator interview questions asked in 2026 — data model, the security and sharing model, Flow automation, data management, reports, releases and real troubleshooting scenarios — with clear answers and notes on what interviewers are checking.
-
Learn SAP SD course with ZebLearn India and boost your career in sales and distribution, get certified and increase your salary
-
ZebLearn India offers comprehensive SAP MM Training to help professionals and freshers master procurement, inventory, and material management processes. With live sessions, hands-on projects, and guidance from industry experts, learners gain practical skills and certification support to advance their careers in supply chain and SAP domains.
-
Get SAP SD training and certification with ZebLearn India, and boost your career in sales and distribution with expert guidance and real-world examples
-
Learn SAP Fiori implementation and boost your career with ZebLearn India's expert training and certification program
-
Unlock your career potential with SAP HR course in India 2026, learn from experts and get certified with ZebLearn India's SAP training program
-
Unlock a rewarding SAP EWM career path with ZebLearn India's expert training and certification, and boost your career in warehouse management
-
Learn SAP EWM course with ZebLearn India and boost your career in warehouse management, get certified and increase your salary
-
Choosing an SAP training course as a career is a strategic decision for anyone looking to build a stable, high-paying, and globally relevant profession. With strong industry demand, diverse career paths, and continuous innovation, SAP skills remain valuable across industries and regions.
-
What every SAP consultant needs to know about Fiori in S/4HANA — design principles, app types, Fiori elements, the launchpad with spaces, pages, catalogs and roles, how apps reach users, key-user extensibility and the troubleshooting steps that come up on every project.
-
Unlock high-demand SAP SuccessFactors jobs in India with expert training and certification, boosting your HR career
-
Unlock the power of SAP MM for efficient procurement and inventory management, and boost your career with ZebLearn India's SAP MM training program
-
Learn SAP MM 2025 and boost your career in procurement and material management with ZebLearn India's SAP MM training program
-
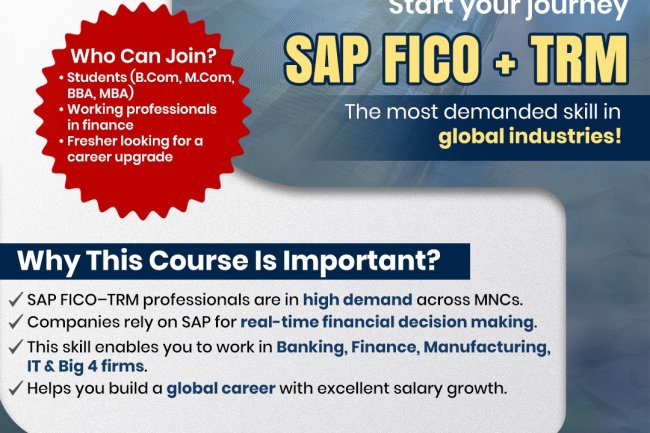
ZebLearn India offers a comprehensive SAP FICO Training Course designed for beginners and professionals seeking expertise in SAP Financial Accounting (FI) and Controlling (CO) modules. The course covers key concepts such as general ledger, accounts receivable/payable, asset accounting, cost center, internal orders, and profit center accounting. Delivered through live online sessions by industry experts, the program emphasizes practical, hands-on experience with real-time projects. Flexible batch options including weekdays, weekends, and personalized schedules ensure learners gain the skills needed to excel in SAP FICO roles and boost their career prospects in finance and accounting domains.
-
Discover the power of SAP SuccessFactors modules and transform your HR career with ZebLearn India's expert training and certification
-
Get SAP HR training in India and boost your career with ZebLearn India's SAP course, learn from experts and get certified
-
SAP SD remains one of the most in-demand SAP modules in the enterprise ecosystem. By enrolling in the SAP SD Training Course Online by ZebLearn India, you gain the technical expertise, practical experience, and career support needed to build a successful future in SAP. Take the next step today and unlock exciting career opportunities in sales and distribution with SAP SD.
-
Discover the difference between SAP S/4HANA and SAP ERP, and learn how to upgrade your skills with ZebLearn India's SAP S/4HANA training program
-
A module-by-module comparison of SAP ECC and S/4HANA — what changed in finance, logistics, master data and the underlying tables, which transactions disappeared, and which differences interviewers actually ask about.
-
Learn SAP HR course syllabus and boost your career in HR management with ZebLearn India's SAP training program
-
SAP FICO and SAP ABAP training classes offer a strong pathway to a successful career in the SAP ecosystem. SAP FICO focuses on managing financial processes, reporting, and cost control, helping organizations maintain accuracy and compliance. SAP ABAP provides the technical expertise needed to develop and customize SAP applications, ensuring systems align with business requirements.
-
A practical guide to breaking into software testing with no prior experience — the skills that actually matter, how to build proof of ability without a job, whether ISTQB is worth it, realistic entry routes in India, and a timeline that holds up.
-
Get SAP BASIS certified and boost your career with ZebLearn India's expert training, learn key features and modules, and understand industry demand and salary scope
-
The demand for SAP PM professionals is continuously growing as companies focus more on asset reliability, cost control, and efficient maintenance. If you have a technical background or interest in maintenance and plant operations, the SAP PM course is a smart step toward a stable and rewarding career.
Start your SAP PM journey today and move closer to a high-growth career in Plant Maintenance and Enterprise Asset Management.
-
Discover the latest on SAP Fiori 2026, its features, and how it can boost your career in SAP with ZebLearn India's expert guidance and training courses
-
Get expert SAP HR training 2026 and boost your career in HR management with ZebLearn India's comprehensive SAP course, featuring real-world examples and India-specific scenarios
-
An SAP resume that gets shortlisted is clear, tailored, and focused on practical skills. By highlighting module expertise, showcasing real-time projects, optimizing for ATS, and avoiding common mistakes, you can significantly improve your chances of landing interviews and advancing your SAP career.
-
Twenty-five SAP MM interview questions freshers are actually asked, with clear answers — enterprise structure, master data, the procure-to-pay cycle, movement types, special procurement, account determination and S/4HANA changes, plus how to prepare without system access.
-
Learn SAP HCM course with ZebLearn India's SAP training program and enhance your career in human resource management
-
Learn SAP HCM training in India 2025 and boost your career with ZebLearn India's SAP training program, get certified and increase your salary up to ₹18-30 LPA
-
Get SAP MM jobs for freshers with ZebLearn India's SAP MM training and certification program, enhancing procurement and material management skills for a successful career
-
Discover top SAP Fiori training institutes in India, unlock career growth with ZebLearn India's SAP Fiori training program
-
Learn SAP ABAP with ZebLearn India's expert-led course and boost your career in SAP development with hands-on training and certification
-
Learn SAP EWM with ZebLearn India's expert trainers and get certified, boosting your career in supply chain management
-
Ten full-stack project ideas that actually impress hiring managers — what each one proves, the features that separate a real build from a tutorial clone, and how to present your portfolio so it survives a technical interview.
-
Learn about SAP S/4HANA certification cost and its benefits, including career growth and salary increase, with ZebLearn India's SAP S/4HANA training program
-
Unlock the power of SAP MM modules for efficient material management and procurement. Discover the benefits and career scope with ZebLearn India's SAP MM training
-
A step-by-step guide to getting Salesforce certified in 2026 — which certification to start with, how to prepare with Trailhead and a free practice org, exam format and cost, booking and exam day, and how to keep the credential active afterwards.
-
Twenty-five Selenium interview questions with clear answers — locators, waits, exceptions and WebDriver basics for freshers, then framework design, Grid, flaky tests and Selenium 4 changes for experienced testers.
-
If you are looking to build a rewarding technical career in SAP, enrolling in SAP BASIS Training and SAP ABAP Training Program is a smart move. These skills are essential for managing, customizing, and optimizing SAP systems in modern enterprises. With the right training, hands-on experience, and continuous learning, SAP BASIS and ABAP professionals can enjoy long-term career growth and global opportunities.
-
Learn SAP BASIS course duration and boost your career with ZebLearn India's expert training and certification program
-
Unlock a lucrative career in SAP BASIS with ZebLearn India's expert guidance and certification, and discover the benefits of this in-demand profession
-
Discover the best ABAP developer jobs in India 2026 and learn how to become a certified SAP ABAP developer with ZebLearn India's training program
-
Discover SAP FICO salary in India and boost your finance career with ZebLearn India's SAP FICO training program
-
Learn SAP EWM with ZebLearn India's expert guide, get certified and boost your career in warehouse management
-
Unlock SAP S/4HANA benefits, career scope and salary in India with ZebLearn India's expert guide and training program
-
SAP ABAP is the core programming language used to develop and customize applications within SAP ERP and S/4HANA. Through SAP ABAP training, learners gain skills in reports, data dictionary, forms, enhancements, and object-oriented ABAP, preparing them for roles like SAP ABAP Developer and Technical Consultant. With high industry demand and strong growth opportunities, SAP ABAP is a powerful choice for building a stable, well-paying IT career in the SAP ecosystem.
-
Discover SAP EWM best practices and boost your career with ZebLearn India's SAP EWM training program, trusted by 5,000+ professionals
-
Unlock SAP MM certification benefits and boost your career in procurement and material management with ZebLearn India's expert guidance
-
Unlock a high-growth career in SAP with ABAP career path and get certified with ZebLearn India's SAP ABAP training program
-
A stage-by-stage guide to the SAP ABAP career path — what to learn first, how classic ABAP differs from S/4HANA development with CDS and RAP, how to get system access, and how developers progress to technical consultant and architect roles.
-
Get certified in SAP BASIS training in India and boost your career with ZebLearn India's expert-led course, covering key features and modules
-
Discover SAP ABAP developer salary in India, with average fresher, mid & senior salaries, and learn how to boost your career with ZebLearn India's SAP ABAP training
-
Learn SAP FICO implementation with ZebLearn India's expert guidance and get certified to boost your finance career
-
Discover the best SAP HR jobs in India, with high demand and excellent salary packages, and learn how to get started with ZebLearn India's SAP training program
-
Get SAP HCM certified and boost your career in human resource management with ZebLearn India's SAP training program
-
Discover the average SAP ABAP salary in India 2025 and boost your career with ZebLearn India's SAP ABAP training program
-
Learn SAP Material Management with ZebLearn India's SAP training and boost your career in procurement and inventory management
-
SAP SD (Sales & Distribution) training focuses on managing the complete order-to-cash business process in SAP, including sales orders, shipping, billing, pricing, and customer management. It is one of the most in-demand functional modules of SAP, widely used across industries such as manufacturing, retail, logistics, and services. The training covers organizational structure, master data, pricing, delivery, billing, and real-time system integration with SAP MM and FI. SAP SD is ideal for graduates, sales professionals, and working executives aiming for ERP consulting careers. With rising global demand and migration to SAP S/4HANA, SAP SD offers strong career growth, high job stability, and international opportunities.
-
Learn SAP S/4HANA with ZebLearn India's expert guide, get certified and boost your career with our SAP S/4HANA tutorial
-
What Salesforce developers earn in India in 2026 — salary bands by experience and employer type, how developer pay compares with admin, consultant and architect roles, the skills and certifications that command a premium, and how to move up faster.
-
Engineering graduates are well-positioned for SAP careers due to their analytical and technical strengths. Top modules include SAP S/4HANA for future readiness, ABAP for programming-focused roles, MM for manufacturing and supply chain, EWM for specialization, and SD for business integration. Choosing the right module based on your interests can set the foundation for long-term professional success.
-
Unlock high-demand SAP ABAP jobs in India with ZebLearn India's training and certification, and boost your career in SAP development
-
Learn SAP Sales and Distribution to boost your career with ZebLearn India's SAP training program and get expert knowledge in sales, distribution, and logistics
-
SAP SuccessFactors is shaping the future of HR by enabling organizations to manage talent more effectively in a digital world. Enrolling in SAP SuccessFactors training is a smart investment for professionals looking to build a stable, high-growth career in cloud-based HR solutions.
With the right training, practical exposure, and guidance, you can become a skilled SAP SuccessFactors consultant and unlock global career opportunities in HR technology.
-
Unlock a successful SAP S/4HANA career with ZebLearn India's expert training and certification, boosting your career prospects in India's top companies
-
Discover SAP BASIS jobs in India, learn about industry demand, and boost your career with ZebLearn India's SAP BASIS training program
-
SAP BASIS and SAP ABAP training classes provide a strong foundation for building a successful career in SAP technology. SAP BASIS focuses on system administration, configuration, security, and performance management, ensuring smooth and stable SAP operations. SAP ABAP, on the other hand, enables professionals to develop and customize SAP applications to meet specific business requirements. Together, these skills create a powerful technical profile with high industry demand. With growing global adoption of SAP systems, trained professionals can access diverse career opportunities, long-term job stability, and excellent growth potential in the enterprise IT domain.
-
Get SAP BASIS training in India 2026 and boost your career with ZebLearn India's expert-led course, enhancing your skills in SAP BASIS administration and management
-
Whether your career goal lies in human resource management or supply chain and warehouse operations, SAP SuccessFactors and SAP EWM are future-proof skills that can significantly enhance your professional growth. With expert-designed training programs, real-time project exposure, and strong career support, ZebLearn India empowers learners to become job-ready SAP professionals and succeed in today’s competitive global market.
-
A complete SAP FICO syllabus breakdown for beginners — every FI and CO sub-module, what each covers, the S/4HANA changes that matter, prerequisites, and a realistic order to learn it in.
-
Learn SAP BASIS online course with ZebLearn India and boost your career in SAP with our expert trainers and certification program
-
Get SAP S/4HANA training in India and boost your career with ZebLearn India's certification program
-
Discover top SAP MM training centers in India, learn about material management and procurement with ZebLearn India's SAP MM training program
-
Get SAP SuccessFactors training in India and boost your HR career with ZebLearn India's certification program
-
Learn SAP FICO basics and boost your finance career with ZebLearn India's SAP FICO training program
-
SAP career-oriented courses are a powerful investment for anyone aiming to build a successful and future-ready career. With global demand, diverse career paths, and continuous innovation, SAP skills open doors to endless opportunities. Choosing the right training program with hands-on learning and expert guidance can be the turning point in your professional journey.
If you’re looking to grow, upgrade, or transform your career, SAP training is a smart step toward long-term success.
-
Enrolling in SAP training with live projects gives you practical exposure, industry-relevant skills, and career support. With limited batch sizes and growing demand for SAP professionals, applying before the deadline can help you fast-track your professional growth.
-
Learn SAP BASIS tutorial with ZebLearn India's expert guidance and boost your career in SAP with our comprehensive SAP BASIS training program
-
-
SAP FICO and SAP HANA training offer a balanced understanding of financial management and high-performance data processing. SAP FICO focuses on accounting, reporting, and cost control, while SAP HANA enables real-time analytics and faster system performance. Together, they create a strong skill set that is highly valued by employers. With rising global demand for SAP professionals, completing training in these modules can lead to excellent career opportunities and long-term professional success.
-
Get SAP MM training in India with ZebLearn India's SAP MM course and boost your career in procurement and material management, earning ₹8-15 LPA
-
Learn SAP MM vs SAP SD with ZebLearn India's expert guide, covering key features, career scope, and certification benefits
-
Unlock career growth with SAP ABAP training, learn from experts and get certified with ZebLearn India's SAP ABAP course
-
So, is SAP possible without coding? Definitely. SAP is not limited to developers; it is a vast ecosystem with opportunities for both technical and non-technical professionals.
If you have been hesitant because you lack programming knowledge, now is the time to rethink that belief. With the right module, proper training, and consistent learning, you can build a stable, high-growth career in SAP — no coding required.
-
Discover top SAP FICO training institutes in India, learn SAP finance and controlling with ZebLearn India's certified course and boost your career
-
SAP training with real-time projects equips learners with practical knowledge, making them job-ready for today’s competitive market. With strong demand for SAP professionals across industries, enrolling in a hands-on training program can significantly enhance your career prospects and help you secure a rewarding future
-
25 SAP S/4HANA FICO interview questions freshers actually face — enterprise structure, the Universal Journal, Business Partner, document splitting, asset accounting, MM-FI integration and period-end closing — with clear answers and notes on what interviewers are checking.
-
Learn SuccessFactors vs Workday comparison, benefits and career scope with ZebLearn India's SAP SuccessFactors training program
-
Discover the ideal SAP ABAP course duration and boost your career with ZebLearn India's expert training and certification
-
Discover the SAP MM salary range in India, including average salaries at TCS, Infosys, and Wipro, and learn how to boost your career with SAP MM training
-
A practical comparison of Workday and SAP SuccessFactors for anyone choosing an HR tech career — how the two systems differ architecturally, where each dominates hiring in India, how accessible training and certification actually are, and which to learn first.
-
High-paying SAP modules in 2026 include S/4HANA, SuccessFactors, EWM, BW/4HANA, ABAP, and FICO. These modules command strong salaries because of their business impact, technical depth, and growing industry demand. With the right training and continuous learning, SAP professionals can build a stable and highly rewarding career.
-
Get SAP EWM certified and boost your career with ZebLearn India's SAP EWM training program, experts in SAP training
-
Discover SAP BASIS salary in India and boost your career with ZebLearn India's SAP BASIS training program, trusted by 5,000+ SAP professionals
-
Get SAP MM training and boost your career in procurement and material management with ZebLearn India's certification program
-
Get SAP HR training and boost your career with ZebLearn India's SAP course, learn SAP HR modules and get certified
-
A SAP FICO training course is a powerful investment for anyone looking to build or advance a career in finance and ERP consulting. By mastering SAP FICO, professionals gain the ability to manage complex financial processes, support strategic decisions, and contribute significantly to organizational success. With strong demand, global relevance, and continuous innovation, SAP FICO remains one of the most rewarding SAP career paths today.
-
-
Learn SAP ABAP training from India's top institute and boost your career with our expert-led SAP ABAP course
-
A practical guide to building a career in SAP S/4HANA in India — functional and technical roles, which module suits which background, the skills employers screen for, indicative salary bands by experience, and how the 2027 ECC deadline is shaping demand.
-
Get SAP MM certification and boost your career in supply chain and procurement with ZebLearn India's expert guidance and training, starting from INR 20,000
-
Learn SAP ABAP course with ZebLearn India's expert trainers and get certified, boosting your career in SAP development with high demand jobs
-
So, what is the highest paying SAP module? Specializations like SAP S/4HANA, SAP FICO, SuccessFactors, ABAP, and SAP SD consistently rank among the top in terms of salary potential. However, success in SAP is less about chasing the highest paycheck and more about mastering the module that fits your strengths.
-
Unlock career growth with SAP HR certification benefits, enhancing your skills in HR management and increasing job prospects
-
Get SAP HCM training online and boost your career in human resource management with ZebLearn India's expert guidance and certification
-
A clear comparison of the Salesforce Admin and Salesforce Developer career paths — what each role actually does, the skills each needs, and how to decide which fits you.
-
If you are looking to build a strong career in ERP and intelligent enterprise technologies, SAP Business One Certification Training and SAP HANA Training are excellent choices. With expert training, real-time project exposure, and certification support, ZebLearn India provides the ideal platform to become a skilled SAP professional and achieve long-term career growth.
-
Learn SAP MM configuration and boost your career in procurement and material management with ZebLearn India's SAP MM training program
-
Learn ABAP programming language with ZebLearn India's SAP MM training and boost your career in SAP development
-
Learn SAP EWM online course and boost your career in supply chain management with ZebLearn India's SAP EWM training program
-
A realistic step-by-step data science roadmap for 2026 — what to learn in what order, how long each stage takes, which skills employers actually filter on, what to skip, and how to tell when you are genuinely job-ready.
-
25 Apex interview questions Salesforce developer candidates actually face — governor limits, SOQL, bulkified triggers, order of execution, asynchronous Apex, security and test classes — with short correct answers, code examples and what the interviewer is really checking.
-
Learn SAP EWM tutorial with ZebLearn India and boost your career in warehouse management, get certified and increase your salary
-
Unlock the power of SAP SuccessFactors 2025 and transform your HR management with ZebLearn India's expert training and certification program
-
Get SAP S/4HANA training and unlock career growth with ZebLearn India's certification program
-
Learn SAP FICO online course and boost your finance career with ZebLearn India's SAP FICO training program, get certified and increase your salary
-
is an SAP career possible after graduation? Without a doubt. For graduates looking to enter a field that combines technology with business knowledge, SAP offers excellent opportunities.
By choosing the right module, investing in quality training, and gaining practical experience, you can build a stable and high-growth career. Instead of feeling uncertain after graduation, consider SAP as a pathway that leads to professional success and long-term security.
-
Discover the benefits of SAP SuccessFactors implementation and learn how to get started with ZebLearn India's SAP SuccessFactors training program
-
Learn SAP ABAP tutorial and boost your career with ZebLearn India's SAP ABAP training program, get certified and increase your salary
-
Unlock the power of SuccessFactors India and boost your career with ZebLearn India's SAP SuccessFactors training program
-
Learn SAP MM course duration and boost your career in procurement and material management with ZebLearn India's SAP MM training program
-
Discover top SAP BASIS training institutes in India, learn about career benefits and get certified with ZebLearn India's SAP BASIS training program
-
Learn about SAP MM job description and its benefits, and discover how ZebLearn India's SAP MM training program can help you master materials management
-
Discover the SAP ABAP job description and its benefits, learn how to become an SAP ABAP consultant with ZebLearn India's SAP ABAP training program
-
Learn SAP MM module with ZebLearn India's expert trainers and boost your career in procurement and material management
-
Discover SAP SD jobs in India, learn about career scope, salary and get certified with ZebLearn India's SAP SD training program
-
Get SAP EWM training in India and boost your career with ZebLearn India's certified course, learn advanced warehouse management and logistics
-
Unlock the power of SAP HCM module and transform your HR management with ZebLearn India's expert training and certification program
-
ZebLearn SAP training receives both positive success stories and some critical feedback. Many learners highlight career growth and job placements, while a few independent reviews raise concerns about support and outcomes. Careful research and comparison can help you decide whether the program aligns with your career goals.
-
Discover the average SAP S/4HANA salary in India and learn how to boost your career with ZebLearn India's SAP S/4HANA training program
-
SAP ABAP training is a valuable investment for anyone looking to build a successful career in SAP development. By gaining practical skills and a deep understanding of ABAP programming, you can contribute to customizing and optimizing SAP solutions that drive business success.
-
SAP courses are evolving with modern technology, emphasizing S/4HANA, cloud platforms, AI, automation, and hands-on learning. Updated training programs focus on real-world business scenarios, practical skills, and performance-based certification, helping learners build future-ready SAP careers.
-
Discover ABAP course fees in India and learn how to advance your SAP career with ZebLearn India's SAP ABAP training program
-
Discover the SAP MM certification cost in India and boost your career with ZebLearn India's SAP MM training program
-
Discover the benefits of an SAP Fiori career path and how it can boost your career with ZebLearn India's SAP Fiori training program
-
The SAP PP Training Course by ZebLearn India is an excellent choice for anyone looking to build a strong career in SAP manufacturing and production planning. With expert trainers, hands-on learning, and real-world project exposure, the course prepares learners to meet industry demands and excel in SAP PP roles with confidence.
-
Unlock SAP HCM jobs in India with ZebLearn India's SAP training, boost career growth and salary up to ₹18-30 LPA
-
Discover the SAP HCM certification cost and its benefits, learn how to get certified and boost your career with ZebLearn India's SAP training program
-
Learn SAP FICO with ZebLearn India's expert-led training, boost career in finance and controlling, and get certified
-
-
Learn SAP EWM vs SAP WM differences, benefits, and career scope with ZebLearn India's SAP EWM training program
-
A current guide to SAP S/4HANA certification — the new practical, open-book exam format, which associate exam fits each role, cost and attempts in India, the 12-month validity rule, and an honest view of when certification is worth it and when it is not.
-
Discover SAP HR jobs in India 2025, explore career scope, salary, and learn how to get started with ZebLearn India's SAP training program
-
Unlock the power of SAP SuccessFactors with our comprehensive tutorial and boost your HR career in India
-
Discover SAP ABAP salary in India 2026 and boost your career with ZebLearn India's SAP ABAP training program
-
The statistics a working data scientist actually uses — descriptive measures, probability and Bayes, distributions, sampling, hypothesis testing, confidence intervals, correlation and regression — with worked examples, what to skip, and how interviewers test it.
-
SAP FICO and SAP EWM training provide a balanced understanding of financial management and advanced warehouse operations. SAP FICO focuses on accounting, reporting, and cost control, while SAP EWM specializes in inventory optimization and warehouse efficiency. Together, they create a strong functional skill set that enhances employability and career growth. With increasing global demand for SAP professionals, completing training in these modules can lead to excellent job opportunities and long-term professional stability.
-
Learn SAP EWM 2025 with ZebLearn India's expert training and certification program, boost your career in warehouse management
-
Learn SAP BASIS with ZebLearn India's expert-led course and boost your career in SAP
-
What Salesforce Agentforce actually is, how an agent works — topics, instructions, actions, reasoning, grounding and guardrails — where companies are using it, what is still hard, and which Agentforce skills are worth learning for admins, developers and consultants.
-
Learn SAP Fiori course with ZebLearn India's expert trainers and get certified, boost your career in SAP
-
Learn SAP MM 2026 with ZebLearn India's expert training and certification program, boost your career in procurement and material management
-
Learn from top SAP HCM training institutes in India, get certified and boost your career with ZebLearn India's SAP training program
-
Discover SAP Fiori benefits and transform your business with ZebLearn India's SAP Fiori training program, enhancing user experience and productivity
-
Get SAP ABAP certification and boost your career with ZebLearn India's SAP ABAP training program, trusted by 5,000+ SAP professionals
-
Get answers to SAP ABAP interview questions and boost your career with ZebLearn India's SAP ABAP training program
-
Learning SAP from zero is completely achievable when you follow a structured path. Understand the fundamentals, choose the right module, gain hands-on experience, and focus on real-world skills. With growing demand across industries, SAP remains one of the most reliable career options for both freshers and working professionals looking for long-term success.
-
Learn about SAP HCM course fees in India and boost your career with ZebLearn India's SAP training program
-
Get certified in SAP Fiori training and boost your career with ZebLearn India's expert-led course, covering key features and real-world applications
-
Learn SuccessFactors course with ZebLearn India's SAP SuccessFactors training and boost your career in HR management
-
Become a certified SuccessFactors consultant with ZebLearn India's training and boost your career in HR management
-
An SAP course for freshers can be a powerful stepping stone toward a stable and rewarding career. It equips you with practical, industry-relevant skills that employers actively seek.
If you want a career that combines technology, business knowledge, and long-term growth, SAP is definitely worth considering. Choose the right module, invest in quality training, and stay committed to your learning journey—the results can shape a bright professional future.
-
Discover the average SAP HR salary in India and learn how to boost your career with ZebLearn India's SAP training program
-
Discover the power of SAP S/4HANA 2026 and unlock its benefits for your business, with ZebLearn India's expert training and certification program
-
What actually changed in SAP MM with S/4HANA — Business Partner for suppliers, the MATDOC inventory model, retired transactions, mandatory Material Ledger, MRP Live, flexible workflow, new output management and Fiori procurement apps — and what stayed the same.
-
Discover the average SAP MM salary in India and boost your career with ZebLearn India's SAP MM training program
-
A practical comparison of the main SAP modules for beginners — MM, SD, FICO, ABAP and the others worth knowing — covering what each involves, who each suits, coding requirements, entry routes in India, and whether you can switch later.
-
A clear comparison of the data analyst and data scientist roles — what each actually does, the skills and tools involved, realistic salary bands in India, which is the easier entry point, and how analysts move into data science later.
-
Unlock the power of SAP SuccessFactors benefits and transform your HR processes with ZebLearn India's expert training and certification program
-
Learn the difference between SAP Fiori and SAP GUI, and how to choose the right tool for your business needs with ZebLearn India's SAP Fiori training
-
Learn SAP SuccessFactors implementation with ZebLearn India's expert guide and boost your HR career
-
Learn SAP S/4HANA implementation and boost your career with ZebLearn India's expert training and certification program
-
SAP course fees in India vary widely depending on the module, training format, and certification level. Entry-level courses typically start around ₹30,000, while advanced programs with certification can exceed ₹3,00,000. Factors such as institute reputation, placement support, and practical training also influence the cost. Although the investment may seem high, SAP certification can lead to strong career opportunities and higher earning potential, making it a valuable choice for long-term professional growth.
-
Get SAP S/4HANA certified and boost your career with ZebLearn India's training program, learn key features and benefits
-
Get SAP ABAP training in India, boost career with ZebLearn India's SAP ABAP course, and become a certified SAP ABAP developer
-
Unlock career growth with SAP S/4HANA course, learn from experts and get certified with ZebLearn India's SAP S/4HANA training program
-
SAP FICO and SAP SuccessFactors training provide a comprehensive understanding of financial management and modern HR systems. SAP FICO focuses on accounting, reporting, and cost control, while SuccessFactors specializes in talent management and workforce optimization. Together, these modules create a strong functional skill set that enhances employability and opens doors to rewarding career opportunities, competitive salaries, and long-term professional growth.
-
Twenty-five SQL interview questions asked in data analyst and data science interviews, with clear answers — joins, aggregation, window functions, NULL behaviour, query reasoning and the live query round.
-
Discover the power of SAP Fiori, a user-centric approach to SAP applications, and learn how to unlock its benefits with ZebLearn India's SAP Fiori training program
-
An honest comparison of Salesforce and SAP as career choices in India — what each platform does, the work, entry routes, learning curve, cost of learning, demand drivers, salary progression and which one suits your background.
-
Discover the SAP ABAP certification cost and benefits, and learn how to get certified with ZebLearn India's SAP ABAP training program
-
A clear, beginner-friendly explanation of Workday HCM — what it does, why companies use it, and how to start learning it.
-
SAP courses provide freshers with a valuable opportunity to develop specialized skills that are in high demand. With flexible eligibility, varying fee structures, and strong job prospects across industries, SAP remains a smart career choice. Selecting the right module and focusing on practical knowledge can help fresh graduates confidently step into a successful professional future.
-
What data scientists actually earn in India in 2026 — salary bands by experience, city, company type and related roles, the skills that command a premium, CTC versus in-hand pay, and how freshers can realistically position themselves.
-
Get SAP FICO training in India from ZebLearn India, a leading SAP training institute, and boost your finance career with expert guidance
-
Discover SAP FICO salary for freshers in India and boost your finance career with ZebLearn India's SAP FICO training program
-
SAP ABAP remains a reliable and rewarding career option for those interested in enterprise software development. With its practical approach, expert guidance, and industry-focused curriculum, ZebLearn India’s SAP ABAP Training Course helps learners build real skills that matter in the job market. If you are serious about building a long-term career in SAP, investing in ABAP training is a step in the right direction.
-
Learn about SuccessFactors certification cost and its benefits, get trained with ZebLearn India's SAP SuccessFactors course
-
Learn SAP HR modules with ZebLearn India's expert trainers and get certified, enhancing your career in HR management with our comprehensive SAP HR course
-
-
Discover SAP FICO salary for freshers in India, learn about career scope, and get certified with ZebLearn India's SAP FICO training program
-
Discover the SAP BASIS certification cost and its benefits for your career in SAP, enroll in ZebLearn India's SAP BASIS training program
-
Learn SAP BASIS vs SAP ABAP with ZebLearn India's expert guidance and boost your career with our SAP BASIS training program
-
Discover the SAP HR course fees and learn how to boost your career with ZebLearn India's SAP training program
-
Unlock SAP MM career opportunities and boost your career in procurement and material management with ZebLearn India's SAP MM training program
-
Learn ABAP programming with ZebLearn India's SAP MM training and boost your career in SAP development with expert guidance and certification
-
Learn SAP MM material management with ZebLearn India's SAP MM training and boost your career in procurement and supply chain management
-
SAP PP training is a valuable investment for professionals aiming to excel in production planning and manufacturing management. With comprehensive knowledge and practical skills in SAP PP, you can contribute to optimizing production processes and advancing your career in the manufacturing sector.
-
The SAP FICO course is evolving rapidly with changes in certification structure, learning platforms, and system capabilities. Professionals who adapt to S/4HANA Finance, embrace practical learning, and stay updated with SAP’s latest innovations will continue to enjoy strong career growth.
-
Discover SAP EWM salary in India and boost your career with ZebLearn India's SAP EWM training program
-
Discover the latest SAP HCM course fees and learn how to become a certified professional with ZebLearn India's SAP training program
-
SAP continues to be one of the most reliable career paths for professionals seeking growth, stability, and attractive salary packages. With limited seats available in upcoming batches, applying early is the smartest move you can make for your future. Do not let hesitation hold you back—invest in your skills today and prepare yourself for the opportunities of tomorrow.
-
Unlock SAP FICO career opportunities and boost your finance career with ZebLearn India's expert training and certification
-
Unlock the power of SAP S/4HANA in India and boost your career with ZebLearn India's expert training and certification
-
Discover top SAP MM training institutes in India, including ZebLearn India, and kickstart your career in supply chain and procurement with expert guidance
-
Unlock the power of SAP EWM and boost your career with ZebLearn India's SAP EWM training program, learn advanced warehouse management and get certified
-
SAP MM (Materials Management) is a core SAP module that helps organizations manage procurement, inventory, and vendor processes efficiently. Through SAP MM training, learners understand enterprise structure, material and vendor master data, the complete purchase cycle, inventory management, invoice verification, and integration with modules like SD, FI/CO, and PP. The course is ideal for graduates, engineers, and working professionals in purchase, stores, and logistics who want to build a career in supply chain and SAP consulting. With high demand across manufacturing, retail, IT, and other industries, SAP MM offers excellent job roles such as SAP MM Consultant, Procurement Specialist, and Material Planner.
-
Learn SAP HR training with ZebLearn India, a leading SAP training institute, and boost your career in human resources management
-
Starting your SAP career with ZebLearn gives you access to industry-relevant training, expert mentorship, practical learning, and career support. With SAP skills in high demand across industries, enrolling in a structured training program can help you secure a rewarding and future-ready profession.
-
Discover the SAP HCM salary package and its benefits, with average salaries in India ranging from ₹4-6 LPA for freshers to ₹18-30 LPA for seniors
-
Unlock SAP S/4HANA jobs with ZebLearn India's training and certification, boost career and salary
-
A step-by-step machine learning roadmap for 2026 — the maths you actually need, the Python stack to learn, which algorithms to start with, what projects to build, and how long each stage realistically takes.
-
Discover top SAP ABAP training institutes in India, boost your career with ZebLearn India's SAP ABAP training program
-
Get SAP FICO training in India and boost your finance career with ZebLearn India's certification program
-
Unlock a successful SAP FICO career with ZebLearn India's expert training and certification, boosting your finance career
-
Learn ABAP vs Java and boost your SAP career with ZebLearn India's SAP ABAP training program, get certified and increase your salary
-
Get the latest SAP BASIS salary for fresher in India and boost your career with ZebLearn India's SAP BASIS training program
-
Learn what is SAP EWM and its benefits, enroll in ZebLearn India's SAP EWM training program
-
Learn SAP HCM India and boost your career with ZebLearn India's SAP training, get expert knowledge and high salary jobs
-
An honest analysis of whether a paid data science course is worth it in India in 2026 — what the job market actually looks like, when a course helps, when it does not, how to evaluate one, and the red flags that should stop you signing up.
-
What Salesforce Data Cloud (now branded Data 360) actually does — ingestion, harmonisation, identity resolution, segments and activation — why it sits underneath Agentforce, and which skills and roles it is creating for Salesforce professionals in India.
-
A language training course is a structured learning program designed to build strong communication skills in a new language by focusing on speaking, listening, reading, and writing. These courses use assessments to tailor instruction to individual proficiency levels and apply interactive teaching methods such as conversational practice, multimedia tools, and real-life simulations. Along with grammar, vocabulary, pronunciation, and comprehension, learners gain valuable cultural understanding that enhances real-world communication. Language training courses improve confidence, expand career opportunities, and support personal and academic growth. With flexible learning formats like online, self-paced, and blended models, modern language training programs cater to diverse learning needs and schedules, making language acquisition more accessible and effective.
-
Discover the ABAP certification cost in India and boost your SAP career with ZebLearn India's expert guidance and training
-
Unlock your potential with SAP ABAP career path, high-demand IT career with ZebLearn India's SAP ABAP training program
-
Learn SAP S/4HANA 2025 and boost your career with ZebLearn India's training program, get certified and increase your salary
-
Learn SAP Fiori 2025 with ZebLearn India's training program and boost your career in SAP
-
Discover the average ABAP developer salary in India and learn how to boost your career with ZebLearn India's SAP ABAP training program
-
Unlock SAP BASIS certification benefits and boost your career with ZebLearn India's expert training, enhancing your skills and knowledge in SAP BASIS
-
Migrate to SAP S/4HANA and boost your career with ZebLearn India's SAP S/4HANA training program, learn the benefits and get certified
-
A SAP FICO Training Course is a powerful upgrade for anyone serious about a long-term career in finance and ERP. It combines your accounting knowledge with global-standard technology skills, making you more valuable in the job market.
-
Unlock SAP Fiori career opportunities and boost your career with ZebLearn India's SAP Fiori training program
-
-
-
The twelve mistakes that most often derail SAP S/4HANA implementations and migrations — from treating it as a technical upgrade to late finance decisions, data and custom code surprises, weak testing and neglected users — with what happens and how to avoid each one.
-
Unlock SAP FICO certification benefits, boost career with ZebLearn India's SAP FICO training program
-
Get SAP BASIS jobs for freshers with ZebLearn India's training and certification program, boost your career in SAP
-
Learn SAP HR course duration and boost your career with ZebLearn India's SAP training program, get certified and increase your salary up to ₹18 LPA
-
Discover SAP Fiori jobs in India, career scope, salary and get certified with ZebLearn India's SAP Fiori training program
-
Compare SAP FICO vs S/4HANA Finance in 2026. Learn key differences, features & career scope. Start your SAP journey today with ZebLearn India!
-
Discover SAP Fiori salary in India, benefits and career scope with ZebLearn India's SAP Fiori training program
-
Learn SAP BASIS course syllabus and boost your career with ZebLearn India's SAP BASIS training program
-
Unlock SAP ABAP certification benefits, boost career with ZebLearn India's SAP ABAP training program
-
A practical comparison of the MERN and MEAN stacks — what actually differs between React and Angular, which is easier to learn first, hiring demand in India, and how to pick one without wasting months.
-
Get certified in SAP MM training in India 2026 and boost your career in procurement, material management, and inventory control with ZebLearn India's expert-led course
-
A step-by-step roadmap for learning machine learning from scratch in 2026 — what to learn first, common pitfalls, and how to build real skills instead of just theory.
-
Discover the SAP MM certification cost and unlock a lucrative career in material management with ZebLearn India's SAP MM training program
-
Unlock SAP BASIS career opportunities and boost your career with ZebLearn India's SAP BASIS training program
-
Learn SAP FICO course duration and boost your finance career with ZebLearn India's SAP FICO training program
-
A practical comparison of Python and R for data science — what each is genuinely better at, where the Indian job market sits, which to learn first depending on your goals, and why the skills that matter most are not language-specific at all.
-
The SAP FICO Training Course by ZebLearn India is designed to help students and professionals build strong expertise in financial accounting and controlling within SAP ERP. The program covers essential FI and CO components such as general ledger, AP/AR, asset accounting, cost center accounting, profitability analysis, and real-time project scenarios. With expert trainers, hands-on SAP server access, flexible learning modes, certification guidance, and Dedicated placement assistance, the course prepares learners for high-demand roles like SAP FICO Consultant, Financial Analyst, and SAP Support Professional. Ideal for finance students, accounting professionals, and freshers, this training provides a solid foundation for a rewarding SAP career.
-
Get trained at a top SAP MM training institute in India and boost your career in procurement and material management
-
Discover the SAP Fiori certification cost and boost your career with ZebLearn India's SAP Fiori training program
-
SAP FICO and SAP HCM training provide a comprehensive understanding of financial management and human resource processes. While SAP FICO focuses on accounting, reporting, and cost control, SAP HCM specializes in payroll, employee administration, and talent management. Together, they create a strong functional skill set that enhances employability, opens doors to rewarding career opportunities, and supports long-term professional growth.
-
Discover top SuccessFactors training institutes in India, get certified and boost your career with ZebLearn India's SAP SuccessFactors training program
-
Unlock high-paying SAP FICO jobs in India with ZebLearn India's expert training and certification, boost your finance career
-
A practical comparison of Adobe Premiere Pro and DaVinci Resolve for anyone starting a video editing career in India — cost, learning curve, colour and audio tools, hardware needs, where each is used professionally, and which to learn first.
-
Get trained in SAP FICO online and boost your finance career with ZebLearn India's expert-led SAP FICO training program
-
SAP training is open to a wide range of learners, including students, graduates, and working professionals from both technical and non-technical backgrounds. There is no strict eligibility requirement to start SAP training; however, having a basic educational qualification and an understanding of business or IT concepts can be beneficial. Eligibility largely depends on the SAP module chosen—functional modules suit commerce, management, and domain professionals, while technical modules are ideal for IT and engineering backgrounds. Prior SAP experience or age limits are not mandatory, making SAP a flexible and accessible career option. With the right module selection and hands-on training, SAP offers strong career growth opportunities across industries.
-
Discover SAP FICO salary 2026 in India, with average salary ranges from ₹4-6 LPA for freshers to ₹18-30 LPA for seniors, and learn how to boost your career with ZebLearn India's SAP FICO training program
-
Learn SAP SuccessFactors course and boost your HR career with ZebLearn India's training program, get certified and increase your salary
-
Get ready to ace your SAP MM interview with our expert guide, covering key concepts, common questions, and career benefits, enroll in SAP MM at ZebLearn India
-
Learn SAP Fiori with ZebLearn India's training program and boost your career in SAP
-
Discover SAP BASIS course fees and learn how to become a certified SAP professional with ZebLearn India's training program
-
The SAP PPSD course at ZebLearn combines SAP Production Planning (PP) and Sales & Distribution (SD) to give learners a complete understanding of how customer demand is linked to production and delivery. The training covers topics like MRP, BOM, routing, production orders, sales orders, delivery, shipping, and billing. With live trainer-led sessions, practical exercises, and interview guidance, ZebLearn helps graduates and working professionals build strong SAP functional skills and prepare for roles in production, supply chain, and ERP consulting.
-
Learn SAP EWM configuration and boost your career with ZebLearn India's SAP EWM training program
-
Unlock SAP MM jobs in India with ZebLearn India's SAP MM training program and boost your career in procurement and material management
-
SAP FICO and SAP SD training provide a strong foundation for building a successful career in enterprise resource planning. SAP FICO focuses on financial management, reporting, and cost control, helping organizations maintain transparency and compliance. SAP SD specializes in sales and distribution processes, enabling efficient order management, billing, and customer service. Together, these modules create a well-rounded functional skill set that connects financial operations with revenue generation.
-
Discover SAP ABAP jobs for freshers and kickstart your career with ZebLearn India's SAP ABAP training program
-
SAP MM is one of the most in-demand and future-ready career paths for professionals aiming to build expertise in supply chain and procurement. With organizations rapidly transitioning to SAP S/4HANA, mastering SAP MM in 2025 can give you a significant competitive edge in the job market.
If you're planning to grow your career in the SAP domain, this is the ideal time to kickstart your SAP MM learning journey and position yourself for high-value opportunities.
-
Get SAP EWM training and boost your career with ZebLearn India's expert courses, learn SAP EWM and enhance your skills in warehouse management
-
Learn SAP Fiori online course and boost your career with ZebLearn India's expert training and certification program
-
In 2026, SAP S/4HANA stands out as the most future-ready option due to rapid technological adoption. SAP FICO continues to offer stability and consistent demand, while SAP MM provides a comfortable entry point for beginners. Meanwhile, SAP SD and SuccessFactors open doors to specialized career paths in sales and HR.
-
Learn SAP ABAP vs Java and boost your career with ZebLearn India's SAP ABAP training program
-
Learn SAP EWM implementation and boost your career with ZebLearn India's SAP EWM training program, get certified and increase your salary
-
Learn SAP MM online course and boost your career in procurement and material management with ZebLearn India's expert training program
-
Unlock a rewarding SAP MM career path with ZebLearn India's expert training and certification, boosting your procurement and material management skills
-
Get SAP HR certified and boost your career in HR management with ZebLearn India's SAP training program
-
Know the SAP ABAP certification cost in India and boost your career with ZebLearn India's SAP ABAP training program
-
Unlock SAP EWM India jobs 2026 with ZebLearn India's training and certification, boost your career with expert guidance
-
A beginner's guide to Salesforce Flow — the flow types and when to use each, the core elements and resources, before-save versus after-save, error handling, bulkification, best practices and when to use Apex instead.
-
SAP is an excellent career option for commerce graduates due to its strong demand and long-term growth opportunities. SAP FICO is widely considered the best module because it aligns directly with accounting and financial knowledge. Alternatives like SAP MM, SD, and SuccessFactors also offer promising paths depending on your interests. Choosing the right module and gaining hands-on experience can help you build a successful future in the SAP ecosystem.
-
If you are looking to build a future-ready career in supply chain management or customer relationship management, enrolling in SAP SCM Training or SAP CRM Training at ZebLearn India is a smart choice. With comprehensive curriculum, practical exposure, and strong career support, ZebLearn India helps learners become skilled SAP professionals and succeed in the global enterprise ecosystem.
-
Unlock the power of SAP Fiori features and boost your career with ZebLearn India's training program
-
A step-by-step guide to building a Salesforce portfolio project recruiters actually notice — choosing a realistic business problem, a complete sample project spec for admin and developer tracks, a build plan, how to document and share it, and how to walk through it in an interview.
-
Discover SAP ABAP course fees in India and boost your career with ZebLearn India's SAP ABAP training program
-
Learn ABAP programming with ZebLearn India's SAP ABAP training and certification course, boost your career in SAP development
-
Discover the average SAP HCM salary in India and boost your career with ZebLearn India's SAP training program
-
Discover the power of SAP SuccessFactors, a cloud-based HR solution, and learn how to leverage it for career growth with ZebLearn India's training program
-
Discover the power of SAP S/4HANA cloud and boost your career with ZebLearn India's SAP S/4HANA training program
-
Learn SAP MM with ZebLearn India's expert trainers and get certified in material management, procurement, and inventory management
-
Get expert SAP ABAP online training and certification with ZebLearn India, and boost your career in SAP development with our comprehensive course
-
Understanding what SAP is and how to learn SAP is the first step toward entering a field filled with opportunity. With the right training, practical experience, and certification, you can build a rewarding career in this ever-growing domain.
The key is to start—choose a module that aligns with your goals, commit to learning, and stay consistent. As businesses continue to embrace digital transformation, SAP professionals will remain at the forefront of innovation.
-
Discover the SAP HR certification cost and its benefits for your career in HR management, including salary expectations and job roles
-
Unlock career growth with SAP BASIS training, enhancing system administration and management skills for a competitive edge
-
Learn SAP Fiori tutorial with ZebLearn India's expert-led course, boost career in SAP Fiori with our certification program
-
Unlock SAP HCM career opportunities and boost your career with ZebLearn India's SAP training program
-
A realistic timeline for learning Workday — how long each stage takes, how your background changes it, why tenant access is the real constraint, and what the first year on a project actually adds.
-
Discover SAP MM course fees in India and boost your career in procurement and material management with ZebLearn India's expert training
-
Learn SAP MM implementation for procurement and material management, and boost your career with ZebLearn India's SAP MM training program
-
The generative AI skills data scientists in India are actually hired for in 2026 — LLM fundamentals, structured prompting, retrieval-augmented generation, evaluation, tool use and agents, cost and safety — plus the classic skills that still matter, three portfolio projects and an eight-week learning plan.
-
Get ABAP training for beginners and boost your career in SAP development with ZebLearn India's expert-led course
-
Discover the best ABAP developer jobs in India and learn how to become a skilled ABAP developer with ZebLearn India's SAP ABAP training program
-
Learn SAP FICO vs SAP FI differences and benefits with ZebLearn India's expert guidance and boost your finance career
-
Learn SAP S/4HANA for beginners and boost your career with ZebLearn India's SAP S/4HANA training program
-
Get SAP FICO training in Delhi and boost your finance career with ZebLearn India's certification program
-
Unlock your potential with SAP SuccessFactors career path and get ahead in the industry with ZebLearn India's training program
-
SAP S/4HANA Finance training is not just a learning opportunity—it’s a strategic move to future-proof your finance career and empower your organization. As businesses accelerate their digital transformation journeys, skilled SAP S/4HANA Finance professionals become invaluable assets.
Don’t get left behind. Embrace the future of finance with SAP S/4HANA Finance training and unlock new levels of efficiency and insight.
-
Learn ABAP programming with our beginner's guide and get certified with ZebLearn India's SAP ABAP training program
-
Learn SAP EWM 2026 with ZebLearn India's expert training and certification program, boost your career in warehouse management
-
Discover SAP HR jobs for freshers and kickstart your career with ZebLearn India's SAP training program, trusted by 5,000+ professionals
-
Learn SAP MM tutorial with ZebLearn India's SAP MM training program and boost your career in procurement and material management
-
Learn SAP MM syllabus and boost your career in procurement and material management with ZebLearn India's SAP MM training
-
SAP BTP Training focuses on building skills required to develop, integrate, and extend SAP applications in a cloud-based environment using SAP Business Technology Platform. It helps professionals gain hands-on experience in application development, data management, analytics, automation, and system integration. With growing enterprise demand for cloud and intelligent technologies, SAP BTP training opens doors to high-paying, future-ready roles such as SAP BTP Consultant, Cloud Developer, and Integration Specialist. It is an ideal choice for SAP professionals, developers, and fresh graduates looking to advance their careers in the modern SAP ecosystem.
-
Discover the power of SAP SuccessFactors features and transform your HR management with ZebLearn India's training program
-
Learn SAP ABAP training online and boost your career in SAP development with ZebLearn India's expert guidance and certification
-
Unlock a successful SAP FICO career path with ZebLearn India's expert guidance and training, boosting your finance career with high demand and salary
-
Discover the average SAP FICO salary 2025 in India and boost your finance career with ZebLearn India's SAP FICO training program
-
Unlock the power of SAP SuccessFactors training and boost your HR career with ZebLearn India's expert-led course
-
Discover SAP SuccessFactors course fees in India and boost your HR career with ZebLearn India's expert training and certification
-
A beginner's guide to SAP S/4HANA — what it actually is, how it differs from ECC, what the Universal Journal and in-memory database changed, deployment options, the 2027 deadline driving migrations, and what it means for your career.
-
Get SAP Fiori certified and boost your career with ZebLearn India's training program, learn from experts and gain hands-on experience
-
Discover the power of SAP SuccessFactors 2026 and boost your HR career with ZebLearn India's expert training, get certified and increase your salary
-
The role of SAP MM in the industry is indispensable for efficient materials and inventory management. Professionals trained in SAP MM become valuable assets, capable of optimizing supply chains, reducing costs, and supporting strategic decision-making. Investing in quality SAP MM training is a smart step toward career growth and organizational success in today’s competitive market.
-
Learn SAP MM course in India with ZebLearn India's expert training and certification program, boost your career in procurement and material management
-
Discover the average SAP SD salary in India 2026 and boost your career with ZebLearn India's SAP SD training program
-
Unlock your finance career with SAP FICO course in India 2025, get certified and boost your salary up to ₹18-30 LPA
-
Get SAP FICO course fees in India and learn how to boost your finance career with ZebLearn India's SAP FICO training program
-
Learn the difference between SAP SuccessFactors and Workday, and how to leverage them for a successful HR career with ZebLearn India's SAP SuccessFactors training
-
Discover the benefits of SAP SuccessFactors and boost your career with ZebLearn India's expert training and certification program
-
Learn SAP S/4HANA on premise with ZebLearn India's training program and boost your career in SAP
-
Get ABAP training for beginners in India and boost your career with ZebLearn India's SAP ABAP training program, learn from experts and get certified
-
Learn SAP SuccessFactors India and boost your HR career with ZebLearn India's training program
-
Discover the world of SAP EWM jobs in India, explore career opportunities, and learn how to get started with ZebLearn India's SAP EWM training program
-
Discover the SAP S/4HANA job description and benefits, and learn how to become an expert with ZebLearn India's SAP S/4HANA training program
-
Unlock your career potential with SAP S/4HANA, a next-generation ERP system, and discover the benefits of SAP S/4HANA career path
-
Get SAP SuccessFactors certification and boost your HR career with ZebLearn India's training program
-
A practical guide to breaking into video editing with no prior experience — what skills to build first, how to create a portfolio without clients, and realistic first steps.
-
A practical introduction to ABAP CDS views in SAP S/4HANA — what they are, view entities versus the older DDIC-based views, associations, annotations, parameters, access control, the virtual data model and how CDS feeds Fiori, RAP and analytics — with working examples.
-
SAP SuccessFactors training is an excellent choice for anyone looking to build a successful career in HR technology and cloud-based HCM solutions. With increasing global demand and strong career growth potential, mastering SAP SuccessFactors can open doors to rewarding roles in leading organizations. Whether you are an HR professional or a fresh graduate, SAP SuccessFactors training can help you stay ahead in the digital HR era.
-
Unlock career growth with SAP HCM training, learn human capital management and boost your career prospects
-
Twenty Workday HCM interview questions freshers are actually asked, with clear answers — supervisory organizations, staffing models, business processes, security groups, reporting and EIB, plus how to prepare without real tenant access.
-
SAP SuccessFactors is transforming how organizations manage their workforce. By investing in SAP SuccessFactors training, you equip yourself with in-demand skills that open doors to global HR tech careers. Whether you are an HR professional, fresher, or SAP consultant, this is the right time to step into the world of cloud-based HR with SuccessFactors and build a strong, future-proof career.
-
Learn SAP SuccessFactors best practices and boost your HR career with ZebLearn India's expert training and certification program
-
Get the best SAP FICO course fees and boost your finance career with ZebLearn India's SAP FICO training program
-
The 25 Python questions that actually come up in data science interviews in India — core language, Pandas, NumPy and practical coding — with short, correct answers and notes on what the interviewer is really testing.
-
Learn SAP HR vs HCM differences, benefits, and career scope with ZebLearn India's SAP training program
-
A full guide to Salesforce careers in India — the roles the ecosystem actually hires for, realistic salary bands, who is hiring, how freshers and career switchers get in, and which specialisations are growing.
-
Discover the benefits of an SAP HR career path and learn how to get started with ZebLearn India's SAP training program
-
Discover the average SAP FICO salary package in India and boost your finance career with ZebLearn India's SAP FICO training program
-
Learn SuccessFactors implementation with ZebLearn India's SAP training and get ahead in your career with our expert guidance and certification
-
Learn SAP Materials Management (MM) with ZebLearn India — understand procurement, inventory management, and how to start a career in SAP MM.
-
Kickstart your career with SAP FICO jobs for freshers and get a comprehensive guide on SAP FICO training and certification
-
which SAP module is best for beginners? The answer depends on your background and career aspirations. Modules like SAP FICO, SAP MM, and SAP SD are often recommended because they are beginner-friendly and widely used across industries. Meanwhile, technical candidates can explore SAP ABAP for development-focused roles.
-
Twelve mistakes that stall most people learning machine learning — from starting with deep learning to data leakage and notebook-only portfolios — with what to do instead at each step.
-
Learn SAP BASIS course with ZebLearn India and boost your career in SAP administration, get certified and increase your salary up to ₹18 LPA
-
-
Learn SAP FICO configuration with ZebLearn India and boost your finance career with our expert training program
-
Learn SAP HR course with ZebLearn India and boost your career in HR management with our expert trainers
-
Discover the average SAP SuccessFactors salary in India and boost your career with ZebLearn India's SAP SuccessFactors training program
-
A straight comparison of manual and automation testing pay in India — typical salary bands at fresher, mid and senior level, why the gap exists, where the manual-only ceiling sits, and how testers close the gap.